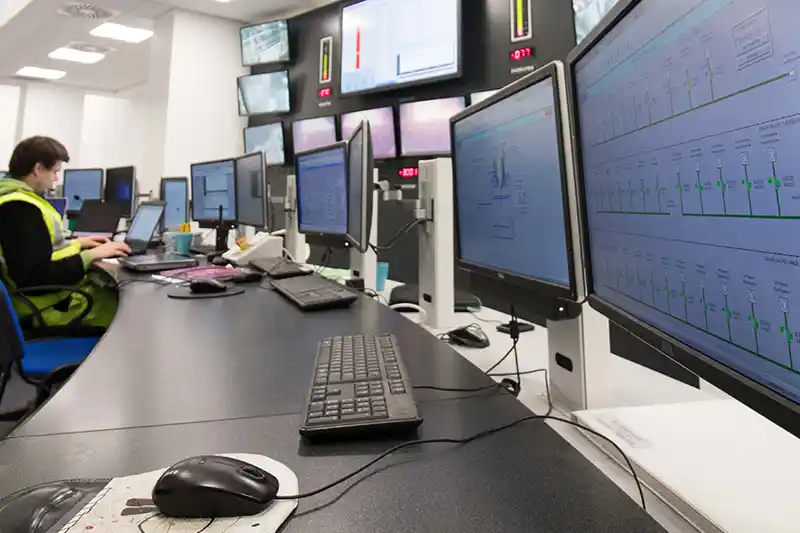
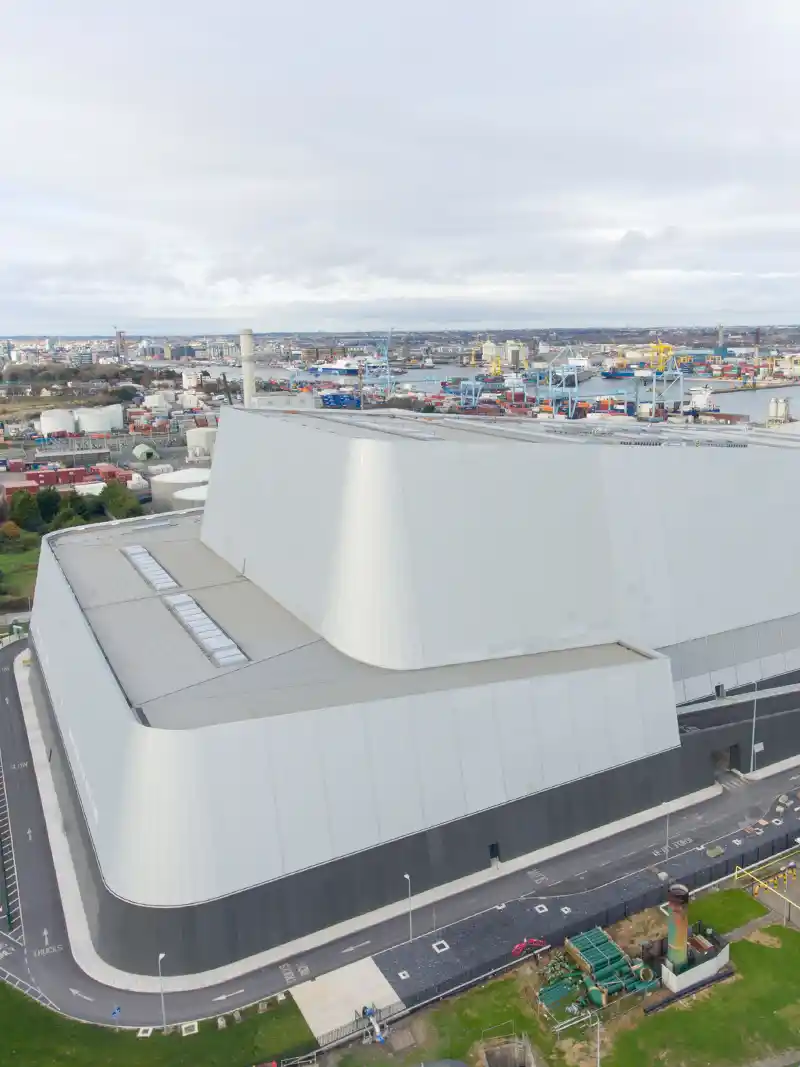
Emissions performance of the Dublin Waste to Energy Ltd. facility is measured and recorded by a continuous emissions monitoring system (CEMS). Emissions data is also collected during source (stack) tests.
Emissions performance of the Dublin Waste to Energy Ltd. facility is measured and recorded by a continuous emissions monitoring system (CEMS). Emissions data is also collected during source (stack) tests.

Emissions performance of the Dublin Waste to Energy Ltd. facility is measured and recorded by a continuous emissions monitoring system (CEMS). Emissions data is also collected during source (stack) tests.
Continuous emissions data on this web page is collected by the facility’s Distributed Control System (DCS) and automatically posted as close to real time as possible for information purposes. Data has not undergone final verification or complete quality control and quality assurance procedure; therefore, this data should not be used in published documents. Final verification and quality control procedures are undertaken on a regular basis and are stored on the DCS master log for regulatory purposes.
Please note that waste is not combusted at temperatures below 850°C. Once the furnace reaches 850°C using auxiliary fuel, it is only then that waste is introduced for combustion.
Note (13th March 2024): As part of our annual maintenance programme, Line 2 is currently offline. Line 1 will be taken offline next week.
N/A - Not applicable
% - Percent
> - Greater than
< - Less than
mg/Nm3 - Milligrams per Normalised metre cubed
avg - Average
Min. - Minimum
°C - Celsius
IDA - Insufficient Data Available
CAL - Analyzer in calibration test
ERR - Calibration error
|
2024
|
Furnace Temparature
|
|---|---|
|
27 July
|
*C
|
| 09:30 | 1043.93 |
| 09:00 | 1045.01 |
| 08:30 | 1037.29 |
| 08:00 | 1036.81 |
| 07:30 | 1038.46 |
| 07:00 | 1034.33 |
| 06:30 | 1045.69 |
| 06:00 | 1050.92 |
| 05:30 | 1047.99 |
| 05:00 | 1064.12 |
| 04:30 | 1071.16 |
| 04:00 | 1068.27 |
| 03:30 | 1038.77 |
| 03:00 | 1050.37 |
| 02:30 | 1048.62 |
| 02:00 | 1062.06 |
| 01:30 | 1053.37 |
| 01:00 | 1058.80 |
| 00:30 | 1043.92 |
| 00:00 | 1057.09 |
|
2024
|
Furnace Temparature
|
|---|---|
|
27 July
|
*C
|
| 09:30 | 1100.58 |
| 09:00 | 1099.14 |
| 08:30 | 1077.42 |
| 08:00 | 1089.50 |
| 07:30 | 1070.67 |
| 07:00 | 1066.53 |
| 06:30 | 1078.41 |
| 06:00 | 1071.84 |
| 05:30 | 1075.24 |
| 05:00 | 1080.73 |
| 04:30 | 1109.84 |
| 04:00 | 1122.18 |
| 03:30 | 1110.94 |
| 03:00 | 1122.76 |
| 02:30 | 1115.90 |
| 02:00 | 1107.64 |
| 01:30 | 1111.05 |
| 01:00 | 1110.15 |
| 00:30 | 1091.83 |
| 00:00 | 1094.20 |

We care about our community and operate well below emissions limits. Over 99.9 percent of what comes out of our plant’s stack is what you’d typically find in air - water vapor, nitrogen, oxygen, and carbon dioxide. The remaining constituents are well below EPA standards.